AWS Observability Stack: CloudWatch, X-Ray, OpenTelemetry & What's Still Missing
AWS Series | Part 16 — Building secure, cost-optimised, cloud-native infrastructure on AWS.
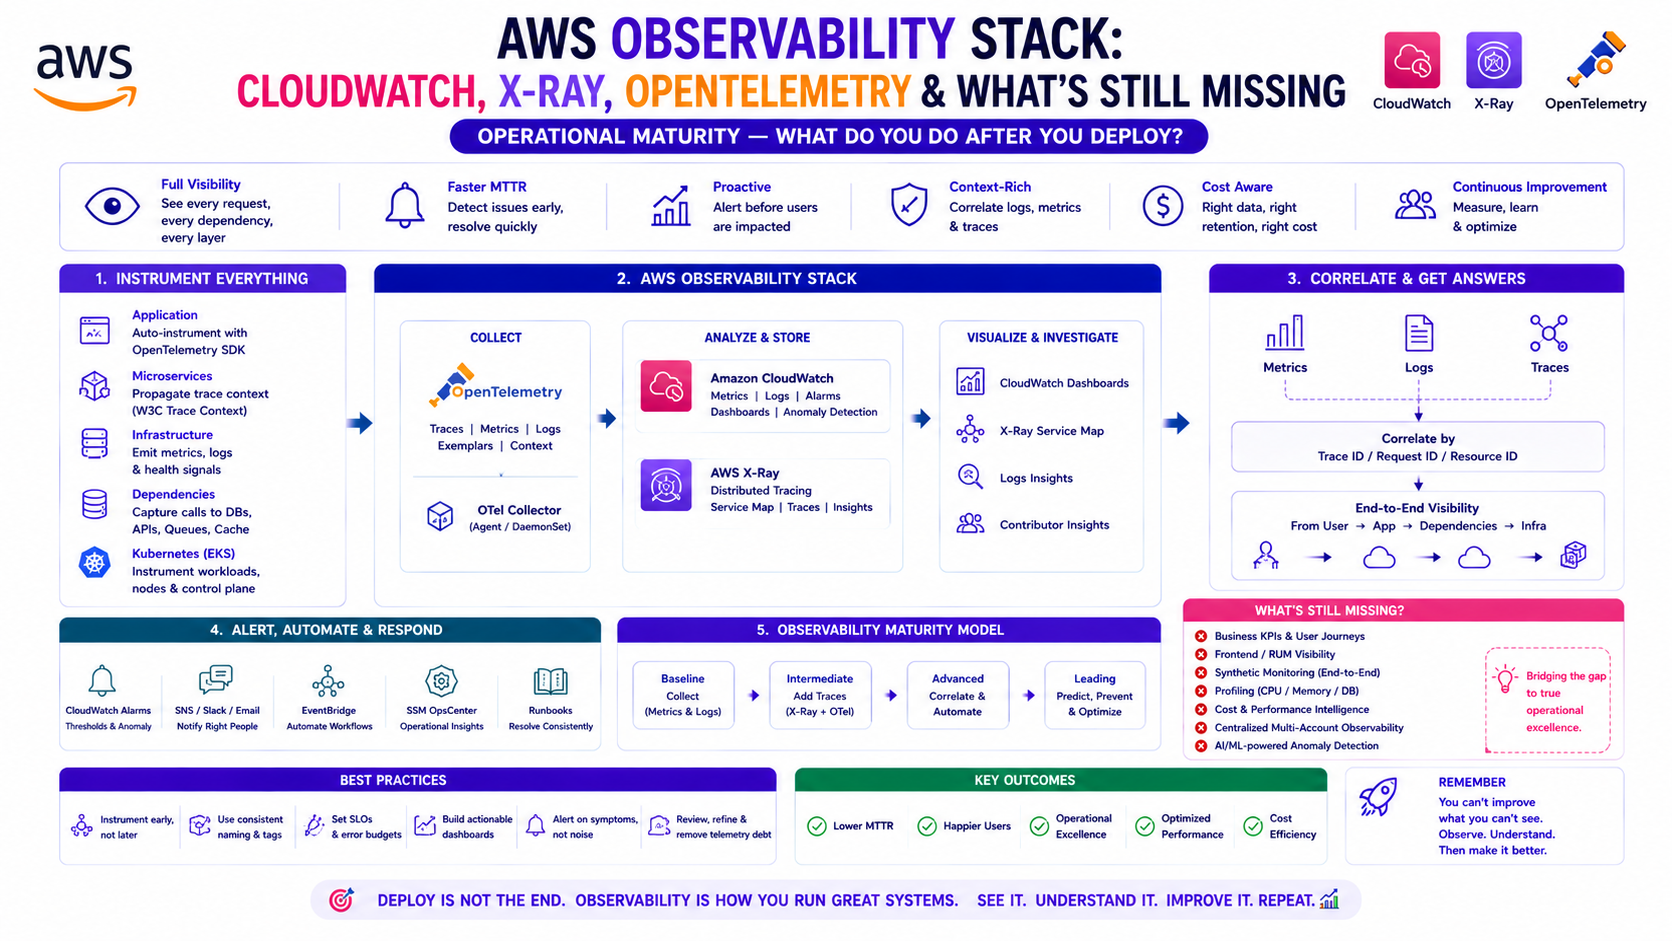
TL;DR
| Tool | What It Does | Layer | When You Need It |
|---|---|---|---|
| CloudWatch Metrics | Time-series metrics from AWS services + custom | Infrastructure | Always — Day 1 |
| CloudWatch Logs | Log ingestion, query, alerting | Application | Always — Day 1 |
| CloudWatch Container Insights | Pod/node/cluster metrics for EKS/ECS | Container | EKS/ECS workloads |
| CloudWatch Alarms | Threshold-based alerting on metrics | Infrastructure | Always |
| AWS X-Ray | Distributed tracing across services | Application | Microservices, latency debugging |
| AWS Distro for OpenTelemetry (ADOT) | Vendor-neutral instrumentation + collection | Application | When you want portability |
| Prometheus + Grafana | Kubernetes-native metrics + dashboards | Container | EKS at scale |
| CloudWatch Synthetics | Canary tests — simulate user traffic | Endpoint | Public-facing APIs |
| CloudWatch RUM | Real User Monitoring — actual browser sessions | Frontend | Web applications |
Introduction — The Incident That Made This Blog Necessary
A newly onboarded microservice entered a crash loop. The pod was failing. No alarm fired. No alert reached the team. The service sat degraded in silence for longer than it should have.
The root cause was simple in hindsight: the CloudWatch log group for that service had not been added to the alarm configuration. The observability stack was monitoring the log groups that existed when it was built — this service was added after. The monitoring had not been extended to cover it.
This is the observability failure mode that nobody talks about: not the absence of tooling, but the gap between what the tools cover and what's actually running. You can have CloudWatch, X-Ray, and OpenTelemetry all deployed and still miss a degraded service because the alarm was never wired up to the new log group.
This post covers the complete AWS observability stack — metrics, logs, traces, alarms, and synthetic monitoring — and more importantly, how to build it so that gaps like this are structurally impossible. Every new service that is deployed automatically gets observability coverage. No manual wiring. No forgotten log groups.
The immediate fix: move from log-based alarms to Container Insights metric alarms on pod_number_of_container_restarts. A metric that exists for every pod in the cluster automatically, without any log group configuration.
The complete stack covered in this post — CloudWatch Container Insights, structured logging with Fluent Bit, distributed tracing with ADOT and X-Ray, CloudWatch Synthetics, and SLO tracking — is the production-grade observability model for any EKS platform. Not all of it needs to be in place on Day 1. The maturity model in Section 9 gives you the right adoption order.
1. The Three Pillars of Observability
Before any tool selection, understand the three distinct signals you need:
Metrics  — What is happening? (CPU 87%, error rate 2.3%, latency p99 340ms)
Logs     — Why is it happening? (stack trace, config error, null pointer)
Traces   — Where is it happening? (which service, which downstream call, which database query)
Each pillar answers a different question. An alarm fires (metric). You open the logs to find the error (logs). You trace the request path to find the bottleneck (traces). You need all three — and they need to be correlated so you can move between them without losing context.
CloudWatch Alarm fires: pod_number_of_container_restarts > 3
    ↓
Open Container Insights: which pod, which node, which namespace
    ↓
Open CloudWatch Logs: what error is the pod throwing
    ↓
Open X-Ray trace: which downstream call is causing the error
    ↓
Root cause: RDS connection pool exhausted — traced to a specific query
Without this chain, you debug by guessing. With it, you debug by following the evidence.
2. CloudWatch Container Insights — The Observability Foundation for EKS
Why Container Insights, Not Log-Based Alarms
The incident described in the introduction happened because alarms were watching CloudWatch log groups — which must be explicitly configured per service. Container Insights metrics are different: they are emitted automatically for every pod, every node, and every cluster once the CloudWatch agent DaemonSet is deployed. No per-service configuration. No forgotten log groups.
Log-based alarm:
  CloudWatch Logs → Metric Filter → Alarm
  Problem: new service = new log group = new metric filter = new alarm = manual step

Container Insights metric alarm:
  CloudWatch Agent DaemonSet → Container Insights → Alarm on pod_container_restarts
  New service = new pod = automatically covered by existing alarm
Deploying the CloudWatch Agent via Helm
# Terraform — CloudWatch agent via Helm
resource "helm_release" "cloudwatch_agent" {
  name             = "amazon-cloudwatch-observability"
  repository       = "https://aws.github.io/eks-charts"
  chart            = "amazon-cloudwatch-observability"
  version          = "1.5.0"
  namespace        = "amazon-cloudwatch"
  create_namespace = true

  set {
    name  = "clusterName"
    value = aws_eks_cluster.main.name
  }

  set {
    name  = "region"
    value = var.region
  }

    # Run on every node — DaemonSet, not Deployment
  # No node selector needed — DaemonSet handles this automatically

  set {
    name  = "containerInsights.enabled"
    value = "true"
  }

  set {
    name  = "fluentBit.enabled"
    value = "true"
  }

  depends_on = [aws_eks_addon.vpc_cni]
}
Key Container Insights Metrics
Once deployed, these metrics are available in CloudWatch under the ContainerInsights namespace — automatically, for every pod:
| Metric | What It Measures | Alarm Threshold |
|---|---|---|
pod_number_of_container_restarts |
Container restart count | > 3 in 5 minutes |
pod_cpu_utilization |
Pod CPU % of request | > 80% for 10 min |
pod_memory_utilization |
Pod memory % of limit | > 85% for 10 min |
pod_network_rx_bytes |
Inbound network bytes | Baseline + 3σ |
node_cpu_utilization |
Node CPU % | > 80% for 15 min |
node_memory_utilization |
Node memory % | > 85% for 15 min |
node_disk_iops |
Node disk I/O | Baseline deviation |
cluster_node_count |
Total nodes in cluster | < minimum threshold |
cluster_failed_node_count |
Failed nodes | > 0 |
The Alarm That Prevents Silent Pod Failures
This is the alarm that would have caught the incident. It monitors container restarts across the entire cluster — every namespace, every pod, every service — with no per-service configuration:
# Alarm on pod restarts — covers ALL pods automatically
# New services are covered immediately when they deploy
resource "aws_cloudwatch_metric_alarm" "pod_restarts" {
  alarm_name          = "eks-pod-container-restarts-high"
  alarm_description   = "Pod restarting repeatedly — likely crash loop. Check CloudWatch Container Insights."
  comparison_operator = "GreaterThanThreshold"
  evaluation_periods  = 2
  metric_name         = "pod_number_of_container_restarts"
  namespace           = "ContainerInsights"
  period              = 300   # 5 minutes
  statistic           = "Sum"
  threshold           = 5     # More than 5 restarts in 5 minutes

  dimensions = {
    ClusterName = aws_eks_cluster.main.name
        # No Namespace or PodName dimension — covers ALL pods cluster-wide
  }

  alarm_actions = [
    aws_sns_topic.platform_alerts.arn,
    aws_sns_topic.pagerduty.arn        # Page on-call immediately
  ]
  ok_actions = [aws_sns_topic.platform_alerts.arn]

  treat_missing_data = "notBreaching"
  tags               = { Name = "pod-restart-alarm" }
}

# Per-namespace alarm — more granular, for teams that own their namespace
resource "aws_cloudwatch_metric_alarm" "pod_restarts_namespace" {
  for_each = toset(["fraud-detection", "payments", "identity", "data-pipeline"])

  alarm_name          = "eks-pod-restarts-${each.key}"
  alarm_description   = "Pod crash loop in ${each.key} namespace"
  comparison_operator = "GreaterThanThreshold"
  evaluation_periods  = 1
  metric_name         = "pod_number_of_container_restarts"
  namespace           = "ContainerInsights"
  period              = 300
  statistic           = "Sum"
  threshold           = 3

  dimensions = {
    ClusterName = aws_eks_cluster.main.name
    Namespace   = each.key   # Scoped to namespace — team-level alert
  }

  alarm_actions = [aws_sns_topic.team_alerts[each.key].arn]
  tags          = { Name = "pod-restarts-${each.key}" }
}
Why this matters in production: The cluster-wide alarm fires regardless of which namespace or service is restarting. A new service deployed yesterday — with no individual alarm configured — is automatically covered. This is the architectural fix for the incident described in the introduction: move from per-log-group alarms to cluster-level metric alarms.
3. CloudWatch Alarms — The Complete Production Set
Alarm Architecture — SNS → Multi-Channel
# SNS topic — routes alerts to multiple destinations simultaneously
resource "aws_sns_topic" "platform_alerts" {
  name              = "platform-alerts"
  kms_master_key_id = aws_kms_key.sns.arn
}

# Slack notification via Lambda
resource "aws_sns_topic_subscription" "slack" {
  topic_arn = aws_sns_topic.platform_alerts.arn
  protocol  = "lambda"
  endpoint  = aws_lambda_function.slack_notifier.arn
}

# PagerDuty via HTTPS endpoint (critical alerts only)
resource "aws_sns_topic_subscription" "pagerduty" {
  topic_arn = aws_sns_topic.platform_alerts.arn
  protocol  = "https"
  endpoint  = var.pagerduty_integration_url
}

# Email — for audit trail
resource "aws_sns_topic_subscription" "email" {
  topic_arn = aws_sns_topic.platform_alerts.arn
  protocol  = "email"
  endpoint  = var.platform_team_email
}
The Minimum Production Alarm Set
locals {
    # Every alarm in this map is created automatically
  # Adding a new alarm = adding an entry here + terraform apply
  cluster_alarms = {
    pod_restarts = {
      metric     = "pod_number_of_container_restarts"
      threshold  = 5
      period     = 300
      stat       = "Sum"
      comparison = "GreaterThanThreshold"
      desc       = "Pod crash loop detected cluster-wide"
    }
    node_cpu = {
      metric     = "node_cpu_utilization"
      threshold  = 80
      period     = 900
      stat       = "Average"
      comparison = "GreaterThanThreshold"
      desc       = "Node CPU above 80% for 15 minutes"
    }
    node_memory = {
      metric     = "node_memory_utilization"
      threshold  = 85
      period     = 900
      stat       = "Average"
      comparison = "GreaterThanThreshold"
      desc       = "Node memory above 85% for 15 minutes"
    }
    cluster_failed_nodes = {
      metric     = "cluster_failed_node_count"
      threshold  = 0
      period     = 60
      stat       = "Maximum"
      comparison = "GreaterThanThreshold"
      desc       = "One or more cluster nodes in failed state"
    }
    node_count_low = {
      metric     = "cluster_node_count"
      threshold  = 2
      period     = 300
      stat       = "Minimum"
      comparison = "LessThanThreshold"
      desc       = "Cluster node count below minimum — Karpenter may not be provisioning"
    }
  }
}

resource "aws_cloudwatch_metric_alarm" "cluster" {
  for_each = local.cluster_alarms

  alarm_name          = "eks-${each.key}"
  alarm_description   = each.value.desc
  comparison_operator = each.value.comparison
  evaluation_periods  = 2
  metric_name         = each.value.metric
  namespace           = "ContainerInsights"
  period              = each.value.period
  statistic           = each.value.stat
  threshold           = each.value.threshold

  dimensions = {
    ClusterName = aws_eks_cluster.main.name
  }

  alarm_actions      = [aws_sns_topic.platform_alerts.arn]
  treat_missing_data = "notBreaching"

  tags = { Name = "cluster-alarm-${each.key}" }
}
ALB Alarms — Application Layer Health
resource "aws_cloudwatch_metric_alarm" "alb_5xx" {
  alarm_name          = "alb-5xx-errors-high"
  alarm_description   = "ALB 5xx error rate above 1% — application errors"
  comparison_operator = "GreaterThanThreshold"
  evaluation_periods  = 3
  threshold           = 1

  metric_query {
    id          = "error_rate"
    expression  = "errors / requests * 100"
    label       = "5xx Error Rate %"
    return_data = true
  }

  metric_query {
    id = "errors"
    metric {
      namespace   = "AWS/ApplicationELB"
      metric_name = "HTTPCode_Target_5XX_Count"
      period      = 60
      stat        = "Sum"
      dimensions = { LoadBalancer = aws_lb.main.arn_suffix }
    }
  }

  metric_query {
    id = "requests"
    metric {
      namespace   = "AWS/ApplicationELB"
      metric_name = "RequestCount"
      period      = 60
      stat        = "Sum"
      dimensions = { LoadBalancer = aws_lb.main.arn_suffix }
    }
  }

  alarm_actions = [aws_sns_topic.platform_alerts.arn]
}

resource "aws_cloudwatch_metric_alarm" "alb_latency_p99" {
  alarm_name          = "alb-p99-latency-high"
  alarm_description   = "ALB P99 latency above 500ms — performance degradation"
  comparison_operator = "GreaterThanThreshold"
  evaluation_periods  = 3
  metric_name         = "TargetResponseTime"
  namespace           = "AWS/ApplicationELB"
  period              = 60
  extended_statistic  = "p99"
  threshold           = 0.5   # 500ms

  dimensions = {
    LoadBalancer = aws_lb.main.arn_suffix
  }

  alarm_actions = [aws_sns_topic.platform_alerts.arn]
}
CI Check — Enforce Alarm Coverage for New Services
This is the CI gate that prevents the "new service, no alarm" gap structurally:
# .github/workflows/observability-gate.yaml
name: Observability Coverage Check

on:
  pull_request:
    paths:
      - 'gitops-config/apps/services/**'

jobs:
  check-alarm-coverage:
    runs-on: ubuntu-latest
    steps:
      - uses: actions/checkout@v4

      - name: Detect new services
        id: new_services
        run: |
          new_dirs=$(git diff --name-only origin/main HEAD | \
            grep "gitops-config/apps/services/" | \
            awk -F/ '{print $3}' | sort -u)
          echo "new_services=$new_dirs" >> $GITHUB_OUTPUT

      - name: Check alarm coverage
        run: |
          for service in ${{ steps.new_services.outputs.new_services }}; do
            alarm_count=$(grep -r "$service" terraform/monitoring/ | \
              grep "aws_cloudwatch_metric_alarm" | wc -l)
            if [ "$alarm_count" -eq 0 ]; then
              echo "❌ ERROR: No CloudWatch alarm found for service: $service"
              echo "Add alarm coverage in terraform/monitoring/ before merging."
              exit 1
            fi
            echo "✅ Alarm coverage confirmed for: $service"
          done
Why this matters in production: The CI check makes alarm coverage a deployment gate, not a post-deployment task. A PR that adds a new service to the ArgoCD ApplicationSet without a corresponding alarm definition in Terraform fails the pipeline. The gap that caused the incident is now structurally impossible.
4. CloudWatch Logs — Structured Logging at Scale
Fluent Bit — Log Routing in EKS
The CloudWatch agent Helm chart deploys Fluent Bit as a DaemonSet. It collects logs from every container on every node and routes them to CloudWatch Logs — one log group per namespace, one log stream per pod.
# Fluent Bit configuration — routes logs to CloudWatch with structured metadata
apiVersion: v1
kind: ConfigMap
metadata:
  name: fluent-bit-config
  namespace: amazon-cloudwatch
data:
  fluent-bit.conf: |
    [SERVICE]
        Flush         5
        Log_Level     info
        Parsers_File  parsers.conf

    [INPUT]
        Name              tail
        Tag               kube.*
        Path              /var/log/containers/*.log
        Parser            docker
        DB                /var/log/flb_kube.db
        Mem_Buf_Limit     50MB
        Skip_Long_Lines   On
        Refresh_Interval  10

    [FILTER]
        Name                kubernetes
        Match               kube.*
        Kube_URL            https://kubernetes.default.svc:443
        Kube_CA_File        /var/run/secrets/kubernetes.io/serviceaccount/ca.crt
        Kube_Token_File     /var/run/secrets/kubernetes.io/serviceaccount/token
        Merge_Log           On
        Keep_Log            Off
        K8S-Logging.Parser  On
        K8S-Logging.Exclude On

    [OUTPUT]
        Name              cloudwatch_logs
        Match             kube.*
        region            eu-west-1
        log_group_name    /eks/$(kubernetes['namespace_name'])
        log_stream_name   $(kubernetes['pod_name'])/$(kubernetes['container_name'])
        auto_create_group true
        retry_limit       2
auto_create_group true — this single setting means new services get their log group created automatically on first log output. No manual log group creation, no missing log groups.
CloudWatch Log Insights — Useful Queries
-- Error rate by service over the last hour
fields @timestamp, @message, kubernetes.namespace_name, kubernetes.pod_name
| filter @message like /ERROR|Exception|FATAL/
| stats count(*) as error_count by kubernetes.namespace_name
| sort error_count desc

-- Slow requests — find responses over 500ms
fields @timestamp, method, path, duration_ms, status_code
| filter duration_ms > 500
| stats avg(duration_ms) as avg_ms, max(duration_ms) as max_ms, count() as count
  by path
| sort avg_ms desc
| limit 20

-- Pod restart events in last 30 minutes
fields @timestamp, @message, kubernetes.pod_name, kubernetes.namespace_name
| filter @message like /Back-off restarting failed container/
| sort @timestamp desc
| limit 50

-- Memory OOM kills
fields @timestamp, @message, kubernetes.pod_name
| filter @message like /OOMKilled|out of memory/
| sort @timestamp desc
Log Retention — Environment-Driven
# Log retention — defined once, applied consistently
locals {
  log_retention = {
    prod    = 90
    staging = 30
    dev     = 7
  }
}

resource "aws_cloudwatch_log_group" "eks_namespace" {
  for_each = toset(var.namespaces)

  name              = "/eks/${each.key}"
  retention_in_days = local.log_retention[var.environment]
  kms_key_id        = aws_kms_key.logs.arn

  tags = { Name = "eks-logs-${each.key}", Environment = var.environment }
}
5. AWS X-Ray — Distributed Tracing
What X-Ray Solves
In a microservices architecture, a single user request touches multiple services before returning a response. CloudWatch metrics tell you something is slow. CloudWatch logs tell you what happened inside one service. Neither tells you which service in the chain is the problem.
That is what distributed tracing solves. When latency spikes or an error occurs, you need to answer:
- Which service in the request path is slow?
- Which downstream call is blocking?
- Which external dependency — database, queue, third-party API — is the bottleneck?
X-Ray traces the complete request path across all services — with timing at each hop — so you can follow the evidence rather than guess.
User request → API Gateway → Scoring Service → Enrichment Service → S3 / RDS
                             [230ms]           [180ms]              [45ms]
                                                ↑ This is your bottleneck
X-Ray with the AWS Distro for OpenTelemetry (ADOT)
The modern approach is not X-Ray SDK instrumentation — it is OpenTelemetry instrumentation with ADOT as the collector. Your application emits standard OpenTelemetry traces. ADOT receives them and forwards to X-Ray. This gives you vendor portability — switch to Jaeger or Datadog later without re-instrumenting your applications.
# ADOT Collector via Helm — receives OTLP traces, forwards to X-Ray
resource "helm_release" "adot_collector" {
  name             = "adot-collector"
  repository       = "https://aws.github.io/eks-charts"
  chart            = "aws-otel-collector"
  version          = "0.33.0"
  namespace        = "amazon-cloudwatch"
  create_namespace = true

  values = [yamlencode({
    mode = "deployment"   # Centralised collector — not DaemonSet

    config = {
      receivers = {
        otlp = {
          protocols = {
            grpc = { endpoint = "0.0.0.0:4317" }
            http = { endpoint = "0.0.0.0:4318" }
          }
        }
      }
      processors = {
        batch = {
          timeout         = "1s"
          send_batch_size = 50
        }
        memory_limiter = {
          limit_mib       = 400
          spike_limit_mib = 100
          check_interval  = "5s"
        }
      }
      exporters = {
        awsxray = { region = var.region }
        awsemf  = {
          region                  = var.region
          namespace               = "EKS/Application"
          log_group_name          = "/aws/eks/application-metrics"
          dimension_rollup_option = "NoDimensionRollup"
        }
      }
      service = {
        pipelines = {
          traces  = { receivers = ["otlp"], processors = ["memory_limiter", "batch"], exporters = ["awsxray"] }
          metrics = { receivers = ["otlp"], processors = ["memory_limiter", "batch"], exporters = ["awsemf"] }
        }
      }
    }
  })]
}
Application Instrumentation — Python Example
# requirements.txt:
# opentelemetry-api, opentelemetry-sdk, opentelemetry-exporter-otlp-proto-grpc
# opentelemetry-instrumentation-fastapi, opentelemetry-instrumentation-requests

from opentelemetry import trace
from opentelemetry.sdk.trace import TracerProvider
from opentelemetry.sdk.trace.export import BatchSpanProcessor
from opentelemetry.exporter.otlp.proto.grpc.trace_exporter import OTLPSpanExporter
from opentelemetry.instrumentation.fastapi import FastAPIInstrumentor
from opentelemetry.instrumentation.requests import RequestsInstrumentor
import fastapi

otlp_exporter = OTLPSpanExporter(
    endpoint="http://adot-collector.amazon-cloudwatch.svc.cluster.local:4317",
    insecure=True
)

provider = TracerProvider()
provider.add_span_processor(BatchSpanProcessor(otlp_exporter))
trace.set_tracer_provider(provider)

app = fastapi.FastAPI()

# Auto-instrument FastAPI — all routes traced automatically
FastAPIInstrumentor.instrument_app(app)
# Auto-instrument outbound HTTP — all requests calls traced
RequestsInstrumentor().instrument()

tracer = trace.get_tracer(__name__)

@app.post("/api/v1/score")
async def score_transaction(transaction: dict):
    with tracer.start_as_current_span("score-transaction") as span:
        span.set_attribute("transaction.id", transaction["id"])
        span.set_attribute("transaction.amount", transaction["amount"])
        span.set_attribute("transaction.currency", transaction["currency"])

        result = await call_enrichment_service(transaction)

        span.set_attribute("risk.score", result["score"])
        span.set_attribute("risk.decision", result["decision"])

        return result
Kubernetes — ADOT Annotations
# Add to any pod spec to enable tracing — no code changes needed
spec:
  template:
    metadata:
      annotations:
        instrumentation.opentelemetry.io/inject-java: "true"
        instrumentation.opentelemetry.io/inject-python: "true"
6. CloudWatch Dashboards — Operational Visibility
The Platform Dashboard
resource "aws_cloudwatch_dashboard" "platform" {
  dashboard_name = "eks-platform-overview"

  dashboard_body = jsonencode({
    widgets = [
            # Row 1 — Cluster Health
      {
        type = "metric"
        properties = {
          title   = "Pod Restarts (All Namespaces)"
          region  = var.region
          metrics = [["ContainerInsights", "pod_number_of_container_restarts", "ClusterName", aws_eks_cluster.main.name]]
          view    = "timeSeries"
          period  = 300
          stat    = "Sum"
          annotations = {
            horizontal = [{ value = 5, label = "Alert threshold", color = "#d62728" }]
          }
        }
      },
      {
        type = "metric"
        properties = {
          title   = "Node CPU Utilisation"
          region  = var.region
          metrics = [["ContainerInsights", "node_cpu_utilization", "ClusterName", aws_eks_cluster.main.name]]
          view    = "timeSeries"
          period  = 60
          stat    = "Average"
        }
      },
            # Row 2 — Application Health
      {
        type = "metric"
        properties = {
          title   = "ALB P99 Latency (ms)"
          region  = var.region
          metrics = [
            ["AWS/ApplicationELB", "TargetResponseTime", "LoadBalancer", aws_lb.main.arn_suffix, { stat = "p99", period = 60, label = "P99" }],
            ["AWS/ApplicationELB", "TargetResponseTime", "LoadBalancer", aws_lb.main.arn_suffix, { stat = "p50", period = 60, label = "P50" }]
          ]
          view = "timeSeries"
        }
      },
      {
        type = "metric"
        properties = {
          title   = "ALB 5xx Error Rate"
          region  = var.region
          metrics = [
            [{ expression = "errors/requests*100", label = "Error Rate %", id = "rate" }],
            ["AWS/ApplicationELB", "HTTPCode_Target_5XX_Count", "LoadBalancer", aws_lb.main.arn_suffix, { id = "errors", visible = false }],
            ["AWS/ApplicationELB", "RequestCount", "LoadBalancer", aws_lb.main.arn_suffix, { id = "requests", visible = false }]
          ]
          view   = "timeSeries"
          period = 60
        }
      },
            # Row 3 — Cost
      {
        type = "metric"
        properties = {
          title   = "Karpenter Nodes Launched"
          region  = var.region
          metrics = [["Karpenter", "nodes_created_total", "NodePool", "spot-general"]]
          view    = "timeSeries"
          period  = 300
          stat    = "Sum"
        }
      }
    ]
  })
}
7. CloudWatch Synthetics — Proactive Endpoint Monitoring
Synthetics runs canary scripts on a schedule — simulating user requests to your endpoints from outside the cluster. If the canary fails, the alarm fires before any real user is affected.
# S3 bucket for canary scripts
resource "aws_s3_bucket" "canary_scripts" {
  bucket = "platform-canary-scripts-${var.account_id}"
}

# Canary — checks the scoring API every 5 minutes
resource "aws_synthetics_canary" "scoring_api" {
  name                 = "scoring-api-health"
  artifact_s3_location = "s3://${aws_s3_bucket.canary_scripts.bucket}/canary-results/"
  execution_role_arn   = aws_iam_role.canary.arn
  handler              = "apiCanary.handler"
  runtime_version      = "syn-nodejs-puppeteer-7.0"
  start_canary         = true

  schedule {
    expression = "rate(5 minutes)"
  }

  run_config {
    timeout_in_seconds = 30
    memory_in_mb       = 960
    active_tracing     = true   # Enable X-Ray tracing for canary runs
  }

  zip_file = data.archive_file.canary_script.output_base64sha256
}
// canary/apiCanary.js — runs every 5 minutes from CloudWatch
const synthetics = require('Synthetics');
const log = require('SyntheticsLogger');
const apiCanary = async function () {
const healthUrl = 'https://api.internal.company.com/health';
const response = await synthetics.executeHttpStep(
'Check health endpoint',
healthUrl,
{ method: 'GET', headers: { 'x-canary': 'true' } }
);
if (response.statusCode !== 200) {
throw new Error(`Health check failed: ${response.statusCode}`);
}
const scoreUrl = 'https://api.internal.company.com/api/v1/score';
const scoreBody = JSON.stringify({
transaction_id: 'canary-test-001',
amount: 1.00,
currency: 'EUR'
});
const scoreResponse = await synthetics.executeHttpStep(
'Check scoring endpoint',
scoreUrl,
{
method: 'POST',
headers: { 'Content-Type': 'application/json', 'x-canary': 'true' },
body: scoreBody
}
);
if (scoreResponse.statusCode !== 200) {
throw new Error(`Scoring endpoint failed: ${scoreResponse.statusCode}`);
}
const body = JSON.parse(scoreResponse.body);
if (!body.decision) {
throw new Error('Scoring response missing decision field');
}
log.info('Canary passed — API healthy');
};
exports.handler = async () => { await apiCanary(); };# Alarm on canary failures
resource "aws_cloudwatch_metric_alarm" "canary_failure" {
alarm_name = "scoring-api-canary-failed"
alarm_description = "Scoring API canary check failed — endpoint may be down"
comparison_operator = "GreaterThanThreshold"
evaluation_periods = 2
metric_name = "Failed"
namespace = "CloudWatchSynthetics"
period = 300
statistic = "Sum"
threshold = 0
dimensions = {
CanaryName = aws_synthetics_canary.scoring_api.name
}
alarm_actions = [
aws_sns_topic.platform_alerts.arn,
aws_sns_topic.pagerduty.arn
]
}8. What's Still Missing — The Honest Gaps
Every observability stack has gaps. Being honest about them is what separates operational maturity from a checkbox exercise.
Gap 1 — No Alerting on What You Don't Know About
Container Insights covers pod restarts, CPU, and memory. It does not cover:
- Business metrics — transaction throughput, fraud detection rate, payment success rate. These require custom CloudWatch metrics emitted by your application.
- Queue depth — SQS queue depth, Kafka consumer lag. These require separate alarms on
AWS/SQSand custom metrics from your consumers. - Database connection pool exhaustion — RDS connection count approaching max_connections is invisible until queries start failing.
# Custom metric — application-level business signal
resource "aws_cloudwatch_metric_alarm" "sqs_queue_depth" {
  alarm_name          = "enrichment-queue-depth-high"
  alarm_description   = "SQS queue depth high — enrichment service may be falling behind"
  comparison_operator = "GreaterThanThreshold"
  evaluation_periods  = 3
  metric_name         = "ApproximateNumberOfMessagesVisible"
  namespace           = "AWS/SQS"
  period              = 300
  statistic           = "Average"
  threshold           = 1000

  dimensions = {
    QueueName = aws_sqs_queue.enrichment_input.name
  }

  alarm_actions = [aws_sns_topic.platform_alerts.arn]
}
Gap 2 — No Correlation Between Logs and Traces
CloudWatch Logs and X-Ray traces are separate consoles. You cannot click from a log line to the trace that produced it — unless you embed the trace ID in your log output:
import logging
import json
from opentelemetry import trace

logger = logging.getLogger(__name__)

class TraceIdFilter(logging.Filter):
    """Injects the current OpenTelemetry trace ID into every log record."""
    def filter(self, record):
        span = trace.get_current_span()
        if span and span.is_recording():
            ctx = span.get_span_context()
            trace_id = format(ctx.trace_id, '032x')
            record.trace_id = f"1-{trace_id[:8]}-{trace_id[8:]}"
            record.span_id  = format(ctx.span_id, '016x')
        else:
            record.trace_id = "no-trace"
            record.span_id  = "no-span"
        return True

# Apply filter to root logger — every log line gets trace context
logging.getLogger().addFilter(TraceIdFilter())

# Structured JSON logging — makes log correlation queryable in CloudWatch Insights
logging.basicConfig(
    format=json.dumps({
        "timestamp": "%(asctime)s",
        "level":     "%(levelname)s",
        "message":   "%(message)s",
        "trace_id":  "%(trace_id)s",
        "span_id":   "%(span_id)s",
        "service":   "scoring-service",
        "namespace": "fraud-detection"
    })
)

def process_request(request_id: str):
    # trace_id is automatically injected into this log line
    logger.info(f"Processing request {request_id}")
Gap 3 — Alert Fatigue Without Runbooks
Alarms without runbooks create alert fatigue — engineers see the alarm, don't know what to do, and start ignoring alerts. Every alarm should link to a runbook:
resource "aws_cloudwatch_metric_alarm" "pod_restarts" {
  alarm_description = <<-EOT
    Pod restarting repeatedly — likely crash loop.
    Runbook: https://wiki.internal.company.com/runbooks/pod-crash-loop
    1. Check Container Insights for the specific pod
    2. Open CloudWatch Logs for the namespace
    3. Look for OOMKilled or configuration errors
    4. If config change, revert the last ArgoCD sync
  EOT
    # ... rest of alarm config
}
Gap 4 — No SLO Tracking
Alarms tell you when something is broken right now. SLOs (Service Level Objectives) tell you how often things were broken over time — and whether you're within your error budget. CloudWatch does not have native SLO tracking. Options:
- AWS Application Signals — AWS-managed SLO framework, released 2024
- Prometheus + Grafana —
slothor manual recording rules for SLO burn rate - Datadog / New Relic — if you have budget for a third-party observability platform
# AWS Application Signals — enables SLO tracking natively
resource "aws_applicationsignals_service_level_objective" "scoring_latency" {
  name        = "scoring-api-p99-latency"
  description = "P99 latency below 200ms — 99.5% of the time"

  sli = {
    sli_metric = {
      metric_data_queries = [{
        id          = "latency"
        metric_stat = {
          metric = {
            namespace   = "AWS/ApplicationELB"
            metric_name = "TargetResponseTime"
            dimensions  = [{ name = "LoadBalancer", value = aws_lb.main.arn_suffix }]
          }
          period = 60
          stat   = "p99"
        }
      }]
    }
    comparison_operator = "LessThan"
    metric_threshold    = 0.2   # 200ms
  }

  goal = {
    attainment_goal   = 99.5
    warning_threshold = 99.0
    interval = {
      rolling_interval = { duration = 7, duration_unit = "DAY" }
    }
  }
}
9. The Observability Maturity Model
Not every team needs every tool on day one. Here's the progression:
| Level | What You Have | What You're Flying Blind On |
|---|---|---|
| Level 1 | CloudWatch Logs, basic EC2 alarms | Pod-level failures, latency distribution |
| Level 2 | + Container Insights, ALB metrics, pod restart alarms | Request traces, business metrics |
| Level 3 | + X-Ray / ADOT tracing, log correlation | SLO tracking, user-facing quality |
| Level 4 | + Synthetics, custom business metrics, SLOs | Prediction, anomaly detection |
| Level 5 | + Anomaly detection, AIOps, full SLO budget tracking | Nothing — this is operational maturity |
Start at Level 2 on Day 1. Container Insights + pod restart alarms + ALB metrics cover the majority of production incidents. Add tracing when you have more than 5 services and start seeing latency issues you cannot localise to one service. Add Synthetics when you have a public-facing API that must be monitored from the outside.
10. Common Mistakes & Anti-Patterns
Mistake 1: Log-Based Alarms for Pod Failures
Log-based alarms require a metric filter per log group per service. Every new service needs manual wiring. Use Container Insights pod_number_of_container_restarts — automatic coverage for every pod from the moment it starts.
Mistake 2: Alarms Without Multi-Channel Notification
A single SNS email subscription means the alarm fires at 2am and nobody sees it until morning. Always route critical alarms to at least two channels: Slack for visibility and PagerDuty/OpsGenie for on-call paging.
Mistake 3: No treat_missing_data Configuration
By default, an alarm with no data reports INSUFFICIENT_DATA — which does not trigger alarm actions. Set treat_missing_data = "breaching" for availability alarms (missing data = service is down) and "notBreaching" for load alarms (missing data = service is idle).
Mistake 4: Tracing Without Log Correlation
X-Ray traces and CloudWatch logs are in separate consoles. Without the trace ID embedded in log output, correlating a slow trace to the log lines that explain it requires manual timestamp matching. Embed the trace ID in structured log output from Day 1.
Mistake 5: Dashboard Without Annotations
A CloudWatch dashboard showing a metric spike is useful. A dashboard showing a metric spike with an annotation that says "Deployed v1.4.2 at 14:32" is invaluable. Automate deployment annotations via EventBridge → CloudWatch dashboard annotations.
Mistake 6: Alarms Without Runbooks
An alarm that fires at 2am and contains no guidance creates panic and delay. Every alarm description should contain: what it means, the immediate diagnostic steps, and a runbook link. This is free — it's a text field on the alarm resource.
Architecture Decision Matrix
| Requirement | CloudWatch | X-Ray / ADOT | Prometheus + Grafana |
|---|---|---|---|
| Infrastructure metrics | ✅ Native | ❌ N/A | ⚠️ Requires exporters |
| Pod / container metrics | ✅ Container Insights | ❌ N/A | ✅ kube-state-metrics |
| Application logs | ✅ Native | ❌ N/A | ❌ N/A |
| Distributed tracing | ❌ N/A | ✅ Native | ⚠️ Jaeger / Tempo |
| Custom dashboards | ⚠️ Limited | ❌ N/A | ✅ Best in class |
| Alerting | ✅ Alarms | ❌ N/A | ✅ Alertmanager |
| AWS-native integration | ✅ Deepest | ✅ Deep | ⚠️ Via exporters |
| Cost | ✅ Pay per use | ✅ Pay per trace | ⚠️ EC2/node cost |
| SLO tracking | ✅ App Signals | ❌ N/A | ✅ With sloth/recording rules |
| No infrastructure to manage | ✅ Fully managed | ✅ Fully managed | ❌ You manage it |
The Golden Rule
"Observability is not a tool you deploy — it is a property you build in from the start. Instrument before you deploy, not after the first incident. Use metric-based alarms over log-based alarms for pod failures — metrics cover new services automatically, log groups do not. Correlate metrics, logs, and traces so you can follow the evidence from alarm to root cause without guessing. And treat every alarm as a contract: if it fires, there must be a runbook, a responsible team, and a defined response time. An alarm nobody acts on is noise. Noise trains engineers to ignore alarms. Ignored alarms mean incidents go undetected. The goal is not more alarms — it is the right alarms, routing to the right people, with the context to act immediately."